When it comes to marketing, most people are… confused.
It drives me crazy when I’m talking to decision makers. It seems like most company leaders are making decisions based on how they’re feeling that day. Not based on specific marketing metrics. Not based on industry benchmarks. Not based on quarterly goals and KPIs.
When you aren’t making marketing decisions backed by intuition AND data, your company is always going to swim in a circle. It’s a lot of trial and error, with no real progress.
Here are the three key marketing metrics every HubSpot user should be tracking. Think of it this way… after you read this post, you’ll be able to make intelligent decisions that are based on real marketing metrics.
Pro tip: When you can do that, it will give you way more authority when you’re making a recommendation to a client. Or when you’re trying to pitch a new campaign idea to your CEO.
1. Traffic Source Data
Looking at traffic data seems like the obvious place to start. But there’s more to it than what meets the eye. For example, if I told you quarter over quarter traffic increased by 78%, that sounds phenomenal. But what does that really mean? Not much. Until you dig deeper.
Seasonal changes in traffic are normal no matter what industry you’re in. If you look at 10 HubSpot portals side by side, you’ll notice that all 10 websites are experiencing traffic dips at similar times. (That’s just how the world works.) And if you’re judging performance based solely on those traffic changes, you’ll never reach the right conclusion.
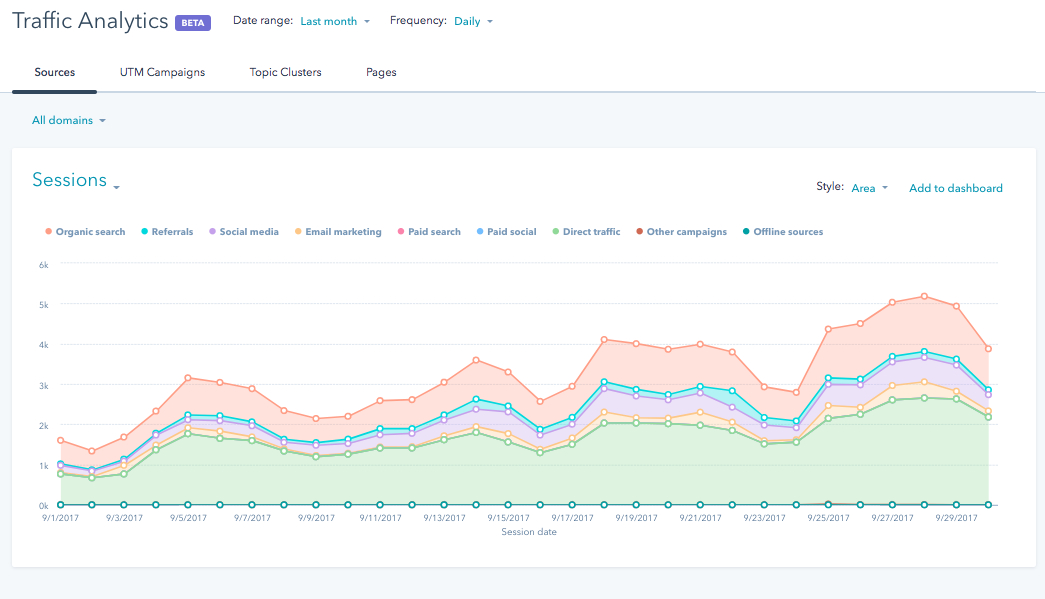
Here’s what you need to do to measure traffic data accurately in HubSpot:
- Look at YoY traffic growth. How did Q2 2020 compare to Q2 2019? (Comparing Q2 2020 to Q1 2020 is great, but it will never tell the whole story.)
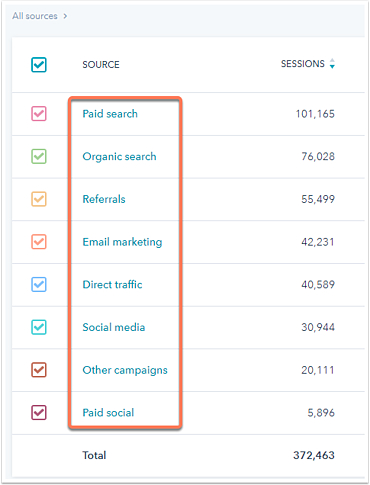
- Look at each traffic source. Again, if your quarterly traffic increases by 78%, that sounds great. But what if that increase was entirely from a paid social campaign? Huge difference compared to seeing that kind of increase in organic traffic.
When you’re in your HubSpot portal, filter traffic by time and by source. If you do this right, eventually the light bulbs will start going off. You’ll clearly see why the traffic changed and what you should do about it.
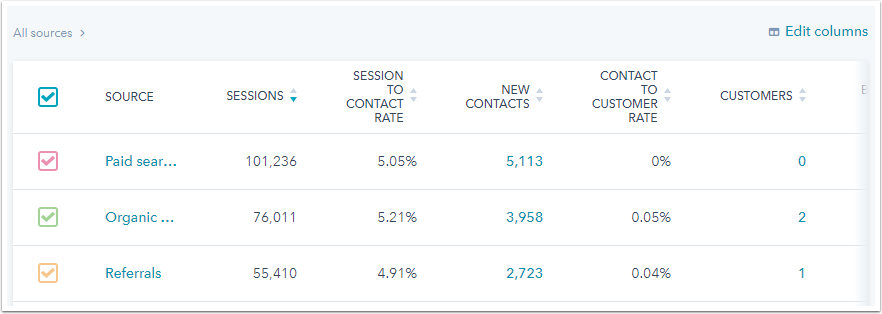
2. Session to Contact Rate
People tend to get excited when they see a jump in website traffic. But an increase in traffic doesn’t mean much unless your site is ALSO converting that traffic into new contacts. (A strong session to contact rate is 2% or higher.)
If your site has a below average conversion rate, you’ve got a problem that needs solving. Here are the first places to look in HubSpot:
- Call-to-action click rates – Do any CTAs on your site have a click rate less than 1%? If so, something needs to change. It’s likely because the content behind the CTA isn’t offering value or the CTA needs a more compelling design.
- Landing page submission rates – A healthy landing page should convert at 10-15% (with a new contact rate of 5-10%). Need to bump up the performance of your landing pages? Try using less form fields. Remove the phone number or don’t make it required. Then shorten the form on mobile.
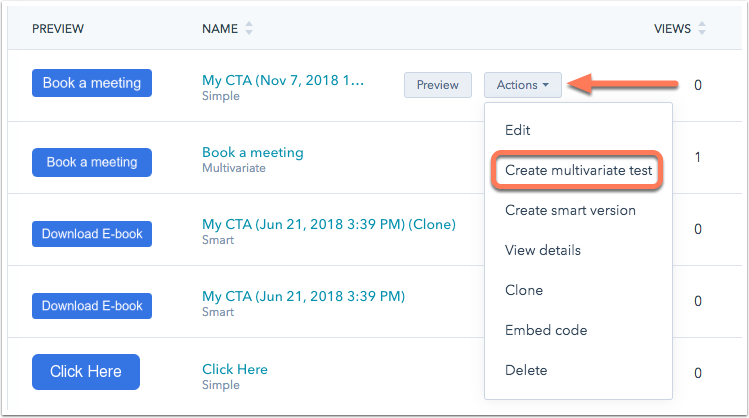
Pro tip: A/B test all of these changes to prove that what you did is really working. Have you created a multivariate test for ALL of your CTAs in HubSpot?
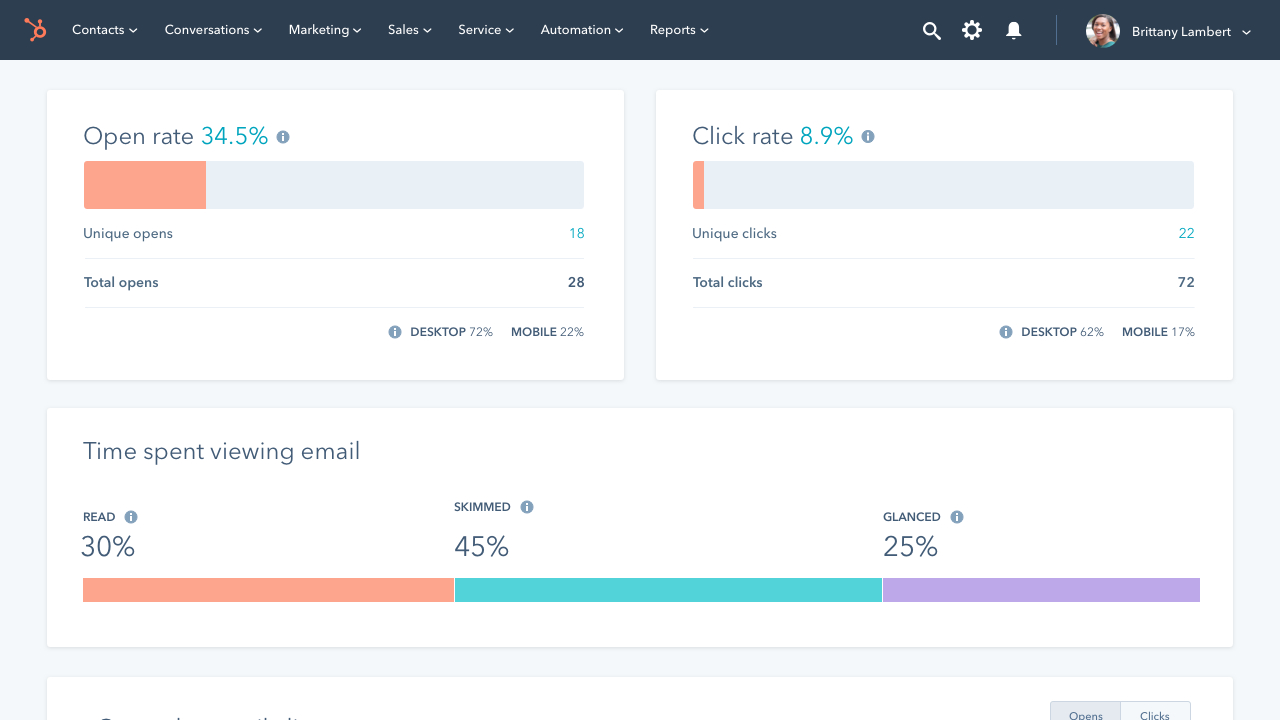
3. Email Marketing Rates
The two most important email marketing metrics are open rate and click rate. On average, email lists typically have an open rate around 20-22% and a click rate around 2-3%.
Stop what you’re doing and look at your email metrics in HubSpot ( Marketing > Email > Analyze). If your emails metrics are less than the above benchmarks, here’s what I would recommend trying first:
- Consider wiping out the lowest engaged contacts from your HubSpot portal to make room for more engaged contacts. This will increase open and click rates (and lower your HubSpot renewal rate).
- Alternatively, you could create a re-engagement campaign that targets your unengaged contacts with the goal of getting them to open or click an email.
- Are you sending a weekly email update to subscribers? Ask your subscribers if they would rather change the frequency of their subscription to bi-weekly or monthly.
- Do all of your emails have at least three CTAs? Be sure to place a CTA in the very first sentence of the email, have an enticing button that’s your primary CTA, and don’t forget to also put a CTA in your PS line.
- Use A/B testing and smart content to optimize emails. Always be testing subject lines, email templates, email copy, and who you’re sending the email from.
Pro tip: For more statistics and industry benchmarks about email marketing, this Mailchimp study is basically the gospel when it comes to data and metrics on email marketing.
The Takeaway (Don’t Miss This)
With all of the above data and recommendations under your belt, you’ll be able to make more powerful marketing decisions. However, don’t forget this. At the end of the day, the ultimate way to judge the success of your marketing efforts in HubSpot is by looking at the number of SQLs you’ve generated. If you’re successfully hitting your quarterly SQL goal, it’s a good sign that everything else is falling into the right place.
P.S. Need help implementing any of the above recommendations? We’re here for you.